Connecting Knock to your New Relic account
You can use the Knock + New Relic integration to stream workflow, channel, and message metrics from your Knock account to your New Relic account. With this you can:
- Set up custom New Relic monitors and dashboards to track your Knock workflows & channels
- Get up-to-the-minute data on workflows triggered and messages delivered
- Monitor events ingested and actions triggered from event platforms like Segment and Rudderstack
What this integration does
This integration will stream metrics from your Knock account to your New Relic account. Metrics are prefixed knock.* and include success and failure codes. Metrics are tagged (where applicable) by:
- Environment
- Workflow key
- Workflow exec mode
- Channel or workflow step type
- Integration source type
- Error reason
Please refer to your New Relic pricing agreement for information on how custom metrics sent to New Relic are priced for your account.
At this time there is no way to selectively enable specific metrics, but metrics will only be emitted to New Relic for features that you are actively using in Knock.
Installing the integration
- Visit the integrations page in your Knock dashboard, and click the "Extensions" tab
- Click "Configure New Relic"
- Enter a New Relic API Key from New Relic's API Keys page (we recommend creating a dedicated key just for Knock)
- Pick the correct site for your New Relic data hosting (visit New Relic's docs for more information)
- Click "Connect"
Dashboard starter kit
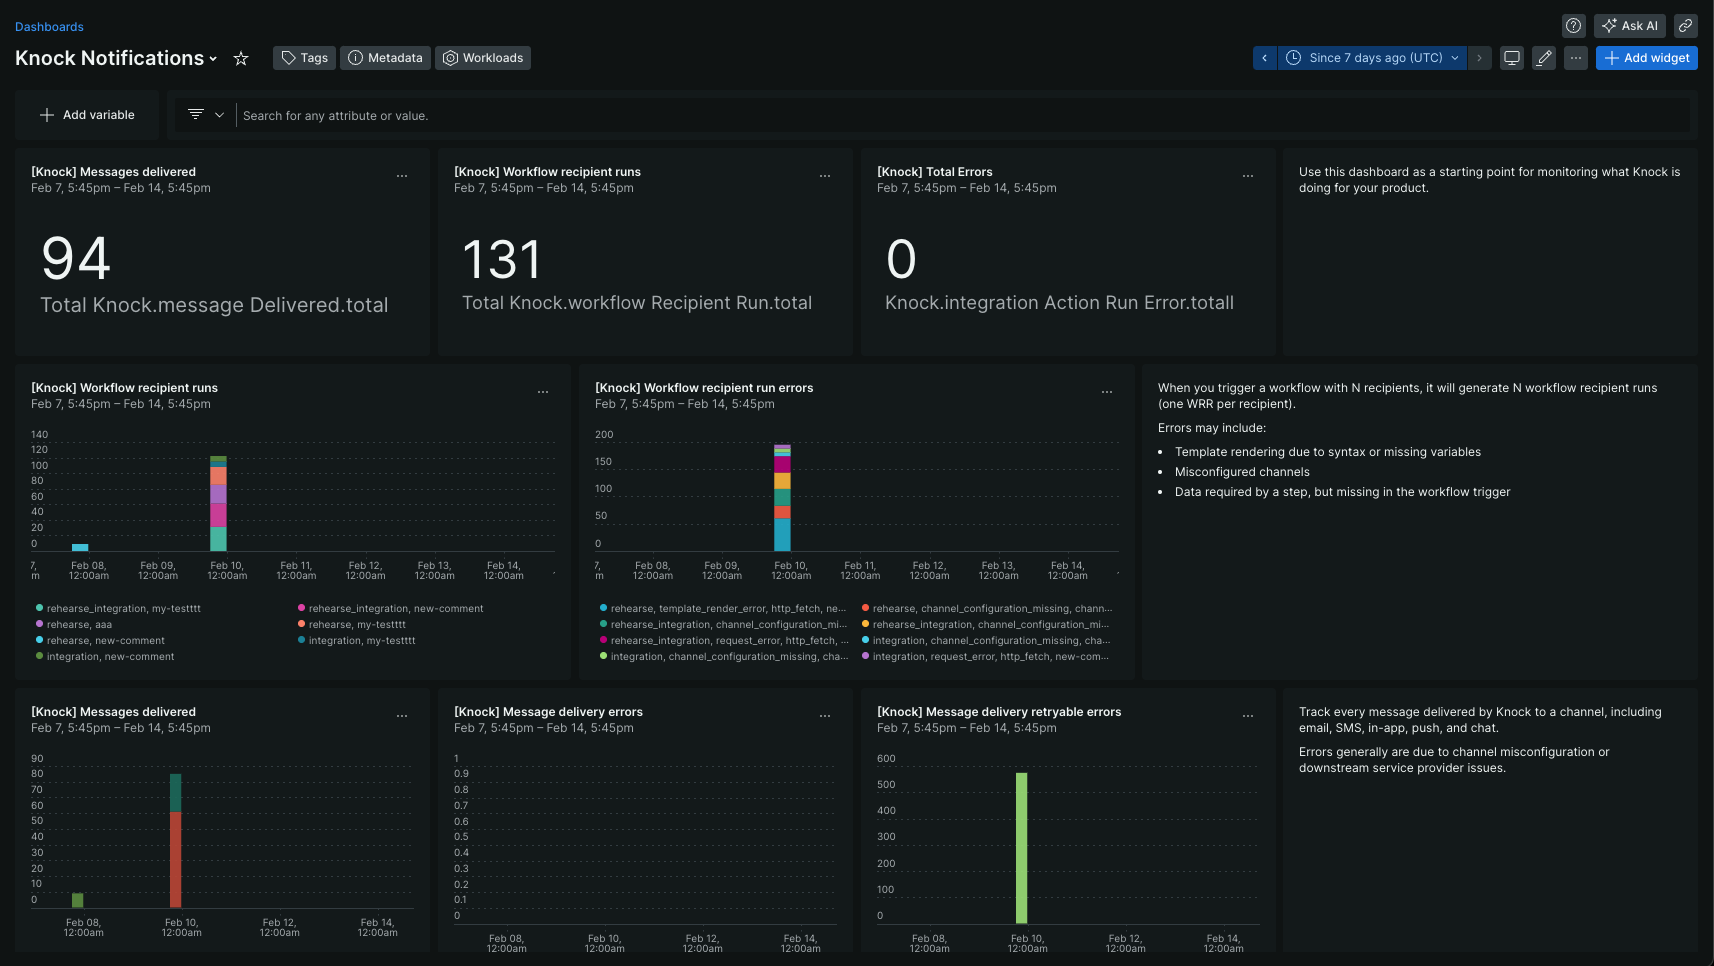
Get started with our New Relic dashboard starter kit to start monitoring Knock metrics with just a few clicks:
- Visit New Relic's all capabilities page and click on "Dashboards"
- In the top-right corner, click "Import dashboard"
- Click the button below to copy the dashboard JSON, and paste it into the New Relic page when prompted.

Reported metrics
- All metrics are segmented by
environmentname (e.g.production,development) - For each of the error cases, the Knock dashboard can provide more insights into specific failures (e.g. misconfigured workflow, channel, or integration action)
Uninstalling the integration
- Visit the integrations page in your Knock dashboard, and click the "Extensions" tab
- Click the "Disconnect" button for the New Relic extension, and then click "Confirm"
- If you created a dedicated New Relic API key for Knock, you can now delete the key from New Relics's API Keys page